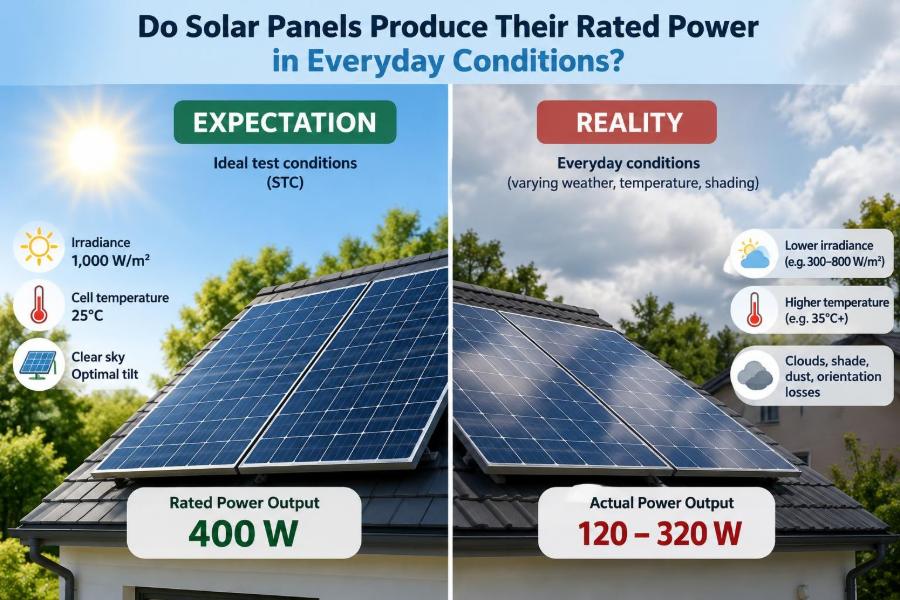

You look at a solar-panel label and see a reassuring number: 400 W, 450 W, perhaps more. It is easy to picture that panel delivering exactly that much power whenever the sun is out.
Then a monitoring app reports a lower number on a bright afternoon, and the question arrives: is something wrong with the system? Often, the answer is no. The label is not a promise about every outdoor moment; it is a measurement made under tightly defined test conditions.
This distinction matters to homeowners estimating savings, engineers designing arrays, and technicians diagnosing faults. It also matters when comparing panels, inverters, batteries, and proposals that use impressive-looking nameplate ratings.
Solar equipment can perform very well while rarely sitting at its rated power. Understanding why turns an apparent disappointment into a useful engineering picture of irradiance, temperature, orientation, electrical conversion, and time.
☀️ The Short Answer: Rated Power Is a Reference Point
Solar panels can produce their rated power in real outdoor conditions, but they do not do so continuously. Reaching the nameplate value requires a combination of strong sunlight, favorable panel temperature, suitable sun angle, and an electrical system able to accept the available power.
More commonly, output moves throughout the day. It rises after sunrise, peaks near the best sun angle, and falls toward evening, with clouds, heat, and shading adding further variation.
A panel’s wattage rating is best understood as a standardized comparison value, not its expected all-day output. It lets buyers compare modules on common ground; it does not describe the energy a panel will produce at a particular roof at a particular time.
🏷️ What the Number on a Panel Actually Means
A panel marked 400 W has a rated maximum power of 400 watts under a specified laboratory condition. Watts measure instantaneous power: the rate at which electrical energy is being produced or transferred at that moment.
That label does not mean the module generates 400 watts every hour of daylight. Nor does it mean it produces 400 watt-hours of energy per day. Energy accumulates over time and is usually expressed in watt-hours (Wh) or kilowatt-hours (kWh).
For example, a hypothetical 400 W panel operating at 200 W for five hours generates about 1,000 Wh, or 1 kWh, during that period. The distinction between power and energy prevents many planning errors.
🧪 Standard Test Conditions Define the Rating
Most module nameplate ratings are measured using Standard Test Conditions, commonly abbreviated STC. These conditions create a repeatable benchmark for manufacturers and laboratories.
STC specifies an irradiance of 1,000 watts per square meter, a cell temperature of 25°C, and a defined solar spectrum known as AM1.5. Irradiance is the solar power arriving on each square meter of surface.
Outdoor systems may occasionally resemble these conditions, especially on clear, cool days with the sun well aligned to the array. But roofs operate in wind, heat, haze, seasonal changes, and changing angles—not in a controlled test chamber.
🔬 Why Laboratory Conditions Are Still Valuable
A laboratory rating is not misleading by itself. Without a common test point, one manufacturer could quote output under intense light while another used weak light, making a meaningful comparison nearly impossible.
STC therefore answers a useful question: under the same defined conditions, which module has the higher maximum power? It supports design calculations, quality checks, and module comparison.
The mistake is treating STC as a weather forecast. A good proposal translates the module rating into an estimated annual energy yield using local solar resource data and expected system losses.
🌤️ Sunlight Intensity Changes Every Hour
Irradiance is the largest immediate driver of photovoltaic output. In broad terms, less light means less current from the solar cells, so power falls.
A thin cloud layer can reduce irradiance even when the sky still looks bright. Morning and late-afternoon sunlight travels through more atmosphere and strikes a fixed panel at a less favorable angle, further reducing the usable light.
Cloud behavior can be surprising. Bright cloud edges may briefly increase irradiance through reflection and scattering, producing short spikes. These events do not change the panel’s basic rating; they show that real solar conditions are dynamic.
📐 The Sun’s Angle Matters More Than It Looks
Panels collect the most direct sunlight when the rays strike close to perpendicular to the module surface. As the angle becomes more oblique, the same beam of sunlight is spread over a larger apparent area of panel.
This is one reason a south-facing array in the Northern Hemisphere, or a north-facing array in the Southern Hemisphere, is often favored for annual production. The best orientation still depends on latitude, roof geometry, electricity-use patterns, and local shading.
Season matters as well. The sun follows a higher path in summer and a lower path in winter in many locations, so a fixed-tilt array cannot remain ideally aligned all year.
🧭 Tilt Is a Design Trade-Off, Not a Magic Setting
Tilt affects how well an array receives sunlight across seasons and how readily rain can wash away loose dust. A steeper tilt may favor lower winter sun, while a shallower tilt may favor summer production.
There is no universal “perfect tilt.” A roof-mounted system is often built at the roof pitch because structural simplicity, wind loading, visual constraints, and installation cost matter alongside a modest energy difference.
Adjustable mounts and trackers can improve alignment, but they add moving parts, maintenance needs, cost, and site requirements. For many rooftop projects, fixed mounting remains the practical choice.
🌡️ Solar Cells Usually Lose Power When They Get Hot
Bright sunshine warms a dark panel. Although the surrounding air may feel comfortable, cell temperature can rise substantially above ambient temperature when wind is low.
For common crystalline-silicon modules, higher cell temperature generally reduces voltage and therefore reduces available power. Module datasheets provide a temperature coefficient, often expressed as a percentage change in power per degree Celsius relative to the test-cell temperature.
The exact effect depends on the module model and operating conditions. The practical lesson is simple: a crisp, sunny cool day can sometimes produce higher instantaneous power than a hotter day with similar sunlight.
💨 Mounting and Airflow Influence Operating Temperature
Panels mounted with an air gap above a roof can shed heat more effectively than panels placed very close to a surface. Wind also carries heat away, though its effect changes with wind direction, array geometry, and mounting details.
This does not mean every installation should use unusually tall mounts. Greater clearance can introduce structural, aesthetic, and wind-load concerns. It does mean thermal behavior belongs in realistic yield estimates.
Building-integrated photovoltaics and tightly mounted arrays deserve particular attention because their heat rejection may differ from that of an open-ground rack.
🌫️ Haze, Humidity, and Air Quality Alter the Light
Not all clear-looking skies deliver identical sunlight at the module plane. Water vapor, dust, smoke, haze, and atmospheric aerosols scatter or absorb parts of incoming radiation.
These effects can reduce direct sunlight while increasing diffuse light—the portion arriving from many directions after scattering in the atmosphere. A panel still produces energy from diffuse light, but usually less than it would from strong, direct, well-aligned sunlight.
Regional climate therefore matters. Two identical systems in different places can have noticeably different annual yields even if their nameplate capacity is the same.
☁️ Diffuse Light Keeps Panels Working Under Clouds
A common misconception is that solar panels need direct, sharp-shadow sunlight to work at all. Photovoltaic cells respond to light, including diffuse skylight, so generation continues under overcast conditions.
The output is simply lower and more variable because irradiance is lower. In a heavily overcast period, a system may produce only a fraction of its clear-sky power; the exact fraction depends on cloud thickness, panel orientation, and local conditions.
Diffuse light also makes orientation somewhat less critical than it is under direct beam sunlight. It does not eliminate the value of good orientation, but it softens the all-or-nothing picture of “sunny versus cloudy.”
🌳 Partial Shade Can Cause a Disproportionate Loss
Shade is not merely a reduction in illuminated area. Solar cells are electrically connected in series within sections of a module, so shading one cell group can restrict current through that path.
Modern modules use bypass diodes to route current around shaded cell sections and reduce damaging reverse-bias conditions. This protection helps, but bypassing part of a module also means losing that section’s contribution.
A chimney shadow, nearby tree branch, antenna, or utility wire can move across an array during the day. A site survey should examine not only noon shade but also morning, afternoon, and winter shadows.
🧹 Soiling Is Small Until It Is Not
Dust, pollen, bird droppings, leaves, industrial deposits, and snow can block light before it reaches the cells. The impact ranges from minor, uniform dimming to localized obstruction that behaves more like partial shade.
Rain may remove loose dust, but it does not reliably clean every deposit. Flat or low-tilt arrays can retain dirt differently from steeper modules, and dry, dusty areas may need a deliberate inspection and cleaning plan.
Cleaning should follow manufacturer instructions and safe rooftop practices. Abrasive tools, harsh chemicals, and cleaning hot glass with very cold water can create avoidable risks.
🔌 The Inverter Is Part of the Power Story
Solar panels produce direct current (DC), while most buildings and grids use alternating current (AC). The inverter converts DC to AC and continuously searches for the voltage and current combination that extracts the most available panel power.
This control process is called maximum power point tracking, or MPPT. Since the best operating point shifts with light and temperature, an inverter must keep adjusting rather than using one fixed voltage.
Inverter conversion is efficient but not lossless. Wiring, connections, protection devices, and transformers where present can also consume a small portion of the available energy.
✂️ DC/AC Ratio and Inverter Clipping
Designers often connect a DC array with a nameplate capacity larger than the inverter’s AC rating. This DC/AC ratio can allow the inverter to operate closer to its useful output range during weaker morning, afternoon, and seasonal sunlight.
When panel DC power exceeds what the inverter can export, the inverter limits its AC output. This is called clipping. A monitoring graph may show a flattened peak on very sunny periods.
Clipping is not automatically a defect. It can be an intentional economic design choice, provided it was modeled appropriately and communicated clearly. The trade-off is some lost peak power in exchange for stronger production at lower irradiance or lower equipment cost.
🪢 Wiring Losses Are Real but Usually Manageable
Every conductor has resistance. Current flowing through DC cables and AC wiring produces a voltage drop and some heat loss, especially if conductors are too small or cable runs are unnecessarily long.
Good design selects conductor sizes, protection devices, and string voltages that keep losses within the project’s intended limits while meeting applicable electrical requirements. Poor connections can create larger losses and, more seriously, heat and reliability risks.
These losses rarely explain a dramatic, sudden production drop by themselves. If output changes sharply, shading, inverter status, grid conditions, or a fault may be more likely causes.
🧩 Mismatch Makes a String Behave Like a Team
Panels in a series string share the same current. If one module is shaded, dirty, oriented differently, or electrically weaker, it can constrain the string’s operating point.
Mismatch also arises when modules with different electrical characteristics are combined carelessly. Their voltage-current curves may not align well under operating conditions.
String layout is therefore an engineering task, not just a wiring exercise. Designers group modules with similar exposure and use appropriate MPPT channels, optimizers, or microinverters where site conditions justify them.
🧠 Optimizers and Microinverters Solve Specific Problems
DC optimizers and microinverters can reduce the effect of module-level mismatch in certain layouts. They can be especially useful where multiple roof faces, intermittent shade, or differing module orientations would make a simple string less effective.
They also provide more granular monitoring in many systems. That can make it easier to identify a persistently underperforming module or a shade pattern.
They are not universally required. More electronics can mean greater cost and additional components on the roof. The right architecture depends on shading, roof geometry, service access, electrical design, and the value of detailed monitoring.
📊 Nameplate Capacity Is Not Annual Energy Yield
A system described as “6 kW solar” refers to rated DC capacity under test conditions. It does not tell you its yearly kWh output without location, orientation, weather, losses, and operating assumptions.
A useful planning concept is specific yield: annual energy produced per unit of installed capacity, often stated as kWh per kW per year. It allows more meaningful comparison between systems in the same broad context.
Specific yield still varies with site conditions. A shaded urban roof and an unshaded open site in the same region can deliver materially different results from identical panels.
⏱️ Peak Sun Hours Simplify Energy Estimates
Peak sun hours do not mean the sun shines at full intensity for a literal block of hours. They represent daily solar energy as an equivalent number of hours at 1,000 W/m² irradiance.
For a rough hypothetical estimate, an array’s rated DC power can be multiplied by peak sun hours and then adjusted for realistic system losses. This is useful for intuition, not a substitute for a detailed site-specific model.
The model should account for monthly weather patterns, array plane orientation, temperature behavior, shading, inverter limits, and expected availability. Annual averages can hide important seasonal differences.
🗓️ Seasonal Output Is Expected, Not a Failure
In many locations, solar output is strongly seasonal. Summer may bring longer days and higher solar angles, while winter brings shorter days, lower sun paths, and potentially more cloud cover.
Temperature adds an interesting countereffect: cool weather can improve module electrical performance, but this often does not fully offset the reduction in winter daylight and irradiance at higher latitudes.
Energy planning should use monthly or seasonal expectations rather than one annual average alone. This is particularly relevant when solar is paired with electric heating, air conditioning, or a battery.
🏠 Roof Geometry Creates Everyday Constraints
Real roofs have vents, skylights, dormers, ridges, setbacks, and structural limits. The largest theoretical array may not be the safest, simplest, or most productive arrangement.
A slightly smaller unshaded array can outperform a larger array compromised by frequent shade or awkward string design. Access pathways for installation, inspection, and emergency considerations also influence the layout.
Panel efficiency helps where roof area is limited, because a higher-efficiency module can provide more rated capacity in the same space. It does not make the system immune to heat, shade, or poor orientation.
🔋 Batteries Change When Energy Is Used, Not How Much Sun Arrives
A battery can store surplus solar electricity for later use, reduce grid imports at certain times, and provide backup capability when the equipment is designed for it. It does not increase the sunlight reaching the panel.
Charging and discharging involve losses, and batteries have power and capacity limits. A battery may be full during a sunny midday, leaving no place for additional stored energy unless the home uses it or exports it.
When evaluating a solar-plus-storage system, separate three questions: how much the array generates, how much the building consumes immediately, and how much can be shifted to another time.
⚡ Grid Limits Can Reduce Exported Output
In grid-connected systems, the inverter must operate within the voltage and frequency limits required by the utility connection. If local grid voltage rises too high, an inverter may reduce output or disconnect temporarily to protect the system and grid.
Some connections also have export limits. A control system may intentionally curtail generation so the exported power stays below an agreed threshold.
These cases are different from poor panel performance. The array may have more DC power available, but the system is deliberately unable or not permitted to deliver all of it to the grid at that moment.
📱 Monitoring Data Needs Context
An app that reports 3 kW is showing a moment, not a verdict. Compare it with the array’s orientation, time of day, weather, module temperature, and inverter AC rating before judging whether it is low.
Daily and monthly energy trends are often more useful than chasing one peak-power screenshot. A sudden sustained deviation from comparable clear days may warrant investigation.
- Check whether the display reports DC power, AC power, or energy.
- Look for inverter warnings, grid events, or communication gaps.
- Compare similar weather periods rather than unlike seasons.
- Inspect safely from the ground for new shade, debris, or visible damage.
🧰 A Sensible Troubleshooting Sequence
Start with simple explanations before assuming equipment failure. Is it cloudy, hot, early or late in the day, or partly shaded? Has a nearby tree grown since installation?
Next, check the inverter status and monitoring messages. A fault code, a grid-disconnection notice, or an unusually flat output profile may offer a more direct clue than the power number alone.
For electrical inspections, rooftop access, connector work, or enclosure opening, use a qualified solar professional. PV circuits can remain energized in daylight even when other equipment is switched off.
🚫 Common Expectations That Lead to Confusion
Several understandable assumptions create disappointment: treating rated watts as a daily energy guarantee, comparing a hot afternoon to a cool laboratory test, or expecting every panel to reach its rating simultaneously on every bright day.
Another mistake is comparing systems solely by installed kW. A lower-rated system with a better orientation, less shade, and suitable inverter design can produce more annual energy than a larger poorly sited one.
Finally, do not assume low production means panels need replacement. A careful diagnosis should distinguish weather and operating limits from soiling, shade, communication problems, inverter settings, and genuine faults.
🧾 What a Good Solar Estimate Should Explain
A useful estimate states the proposed module capacity, inverter rating, expected annual energy, and major assumptions. It should identify orientation, tilt, shading treatment, expected losses, and whether export limits or battery behavior affect the result.
Ask whether the estimate uses site-specific solar data and whether it provides monthly production expectations. Also ask what has been assumed about future tree growth, roof obstructions, and local grid constraints.
Predictions remain estimates because future weather and household use cannot be known precisely. Transparent assumptions are more valuable than an unrealistically precise promise.
🧮 A Simple Hypothetical Day
Imagine a 5 kW-rated rooftop array. At sunrise it may produce only a small fraction of that rating because the irradiance and angle are poor. Around solar noon, strong sunlight could drive it close to its rating, but a hot roof may keep it below the STC figure.
Later, a passing cloud lowers power quickly, and then a chimney shadow crosses part of one string. If the inverter is rated below the array’s DC capacity, the clearest midday peak may also be capped.
None of those conditions automatically signals failure. Together, they describe normal operation in an environment that changes minute by minute.
📏 Performance Ratio Connects Model and Reality
Engineers often use performance ratio to compare actual energy with the energy that would be expected from the measured solar irradiation on the array plane at rated efficiency. It helps separate solar-resource changes from system losses.
Performance ratio includes the combined effect of temperature, inverter conversion, wiring, mismatch, soiling, availability, and other losses. Its interpretation requires accurate irradiance data and careful boundaries, so it is more useful for technical assessment than casual app checking.
A single low daily value does not prove a problem. Trends over suitable comparison periods are more informative, especially when weather and seasonal conditions are considered.
🔧 Design Choices Should Match the Site
The best solar design is not always the one with the largest advertised wattage. It is the arrangement that converts the available solar resource safely and reliably within the site’s roof, electrical, budget, and maintenance constraints.
That may mean selecting higher-efficiency modules for limited space, separating roof faces onto different MPPT inputs, managing a known shading obstacle, or accepting limited clipping as part of the design.
It may also mean deciding that a difficult roof is not suitable for a large array. Good engineering includes recognizing constraints rather than hiding them behind nameplate numbers.
🎯 The Core Principle: Compare Like With Like
Rated power answers an equipment-comparison question under standard conditions. Real-world production answers a site-and-time question shaped by weather, geometry, temperature, shading, and the rest of the electrical system.
Use watts to understand instantaneous capability, kWh to understand energy over a period, and site-specific estimates to set expectations. Review monitoring trends with comparable weather and operating conditions in mind.
Solar panels are not underperforming simply because they are below their label rating; they are responding to the real conditions in which every outdoor energy system operates.
Judge a solar array by well-explained energy production over time, not by whether a single live power reading always matches its laboratory nameplate. With that expectation in place, the numbers on the app become far more useful—and far less mysterious. ☀️⚡📈